14/11/2024 0 Comments
How to create a Detection Engineering Lab — Part 1
Setting up a Lab lets you mimic real-world TTPs in a safe environment, making it easy to test, build and fine-tune detection logic.
I’m writing this blog aiming to help people that work in the field of security operations, detection engineering or are interested in cyber security and want to explore and extend theoretical and practical knowledge.
I’m structuring the Lab in the sense that it can function as a detection engineering environment, but it can very well be utilized for testing other security operations purposes like creating dashboarding, alert configuration, etc.
Why ?
Setting up a Lab lets you mimic real-world TTPs (Tactics, Techniques, Procedures) in a safe environment, making it easy to test, build and fine-tune detection logic. Having practical experience in setting up such a testing environment is also a valuable addition to your resume during job interviews.
And it’s fun of course.
Short intro on detection engineering in general
A detection (engineering) environment generally helps to protect assets by developing logic that function as, how i like to describe it to my non-tech friends, “digital tripwires”.

Threat actors that are moving laterally through a network should be detected somewhere during their malicious activity — ideally as soon as possible — after which alerts fire, the security team jumps in.. all that stuff.
Yet, to create the logic to detect malicious activity “we” as defenders need telemetry or logs. IT systems generate all sorts of logs (system, security, endpoint, network, etc.). Collecting the right log sources is crucial for finding anomalous activity or the needle in a haystack. This is not a blogpost about what are the bread and butter log sources, although I can dedicate another blog on this subject alone.
Most of the time logs are forwarded to a central log server (can be part of a SIEM solution) where they are collected, hereafter on top of various log sources and telemetry, detections can be developed, monitored and alerting can be configured.
Scope
The scope of our “infrastructure” will be:
- Elastic stack
- Docker
- Digital Ocean (cloud service provider)
I chose a cloud solution primarily for its ease of access. I enjoy being able to access the Kibana web interface anytime, without the hassle of managing my own server or setting up anything on-premises. I’m using Docker because it offers flexibility in deploying and managing apps consistently. It’s also a great way to gain experience with containerization.
Of course, this is just my personal preference.
Requirements
For this part there are no technical requirements since we’ll be hosting the infrastructure in the cloud, however in part 2 we will also be setting up a virtual machine which has some minimum requirements. We will install the Elastic agent on the VM so that it will function as the first host with event forwarding configured.
The elastic stack
Elasticsearch is developed alongside the data collection and log-parsing engine Logstash, the analytics and visualization platform Kibana, and the collection of lightweight data shippers called Beats. The four products are designed for use as an integrated solution, referred to as the “Elastic Stack”. Another component of the Elastic Stack is the Fleet server, which is used to centrally manage Elastic Agents.
Elastic is open source and easy to setup by using Docker and the Docker-compose plugin. Docker simplifies any procedure of configuring and maintaining servers or other operating systems by utilizing virtualization.
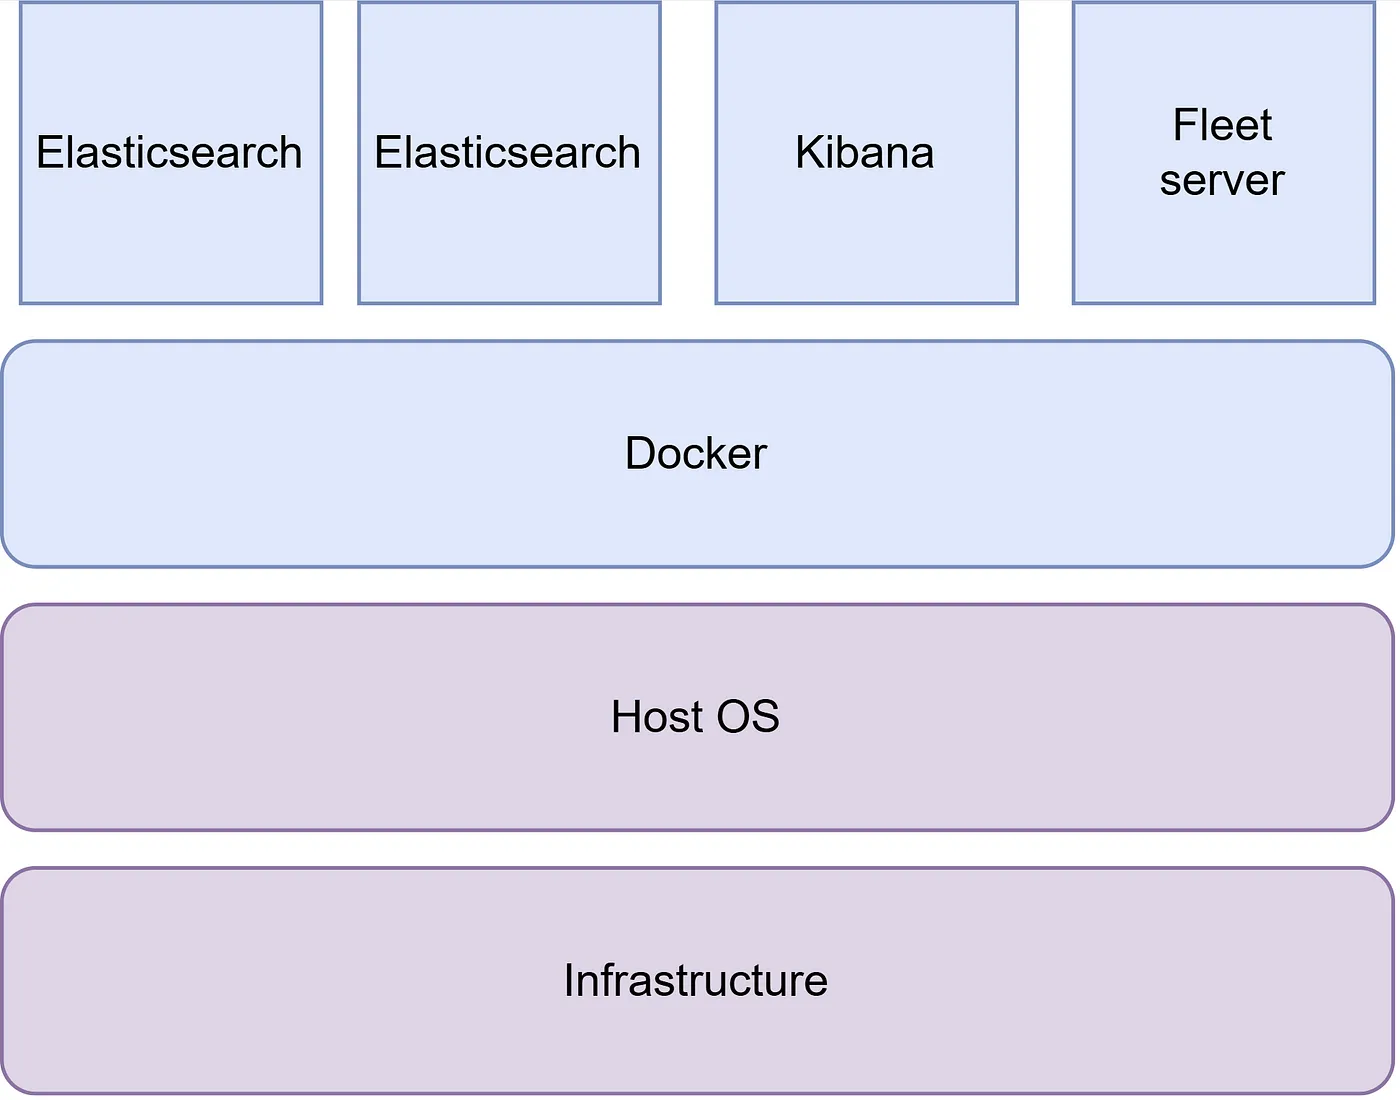
See below high level containerized architecture to give you an idea of the end objective of the environment, in blue is within our configuration scope.

High level architecture of Lab environment
OK now let’s dive in.
Step 1: Setting up your Digitalocean account
We’ll be setting up a Digital Ocean droplet to host our docker containers. Digital Ocean Droplets are Linux-based virtual machines (VMs) that run on top of virtualized hardware. Each Droplet you create is a new server you can use, either standalone or as part of a larger, cloud-based infrastructure.
If you already have an Digital Ocean account please move to step 2.
- Browse to: https://www.digitalocean.com/
- Click “Sign up” on your upper right;
- You can choose to continue via Google, Github or Email;
- Follow and finalize the sign-up steps.
You should select a payment option since we’ll be hosting our docker containers in the cloud. Digital Ocean is a go-to for me due to it being very easy to spin things up and has very affordable solutions. I'll be touching a bit more on pricing later on.
Step 2: Create a new project
- Browse to: https://www.digitalocean.com/
- Log in to your account;
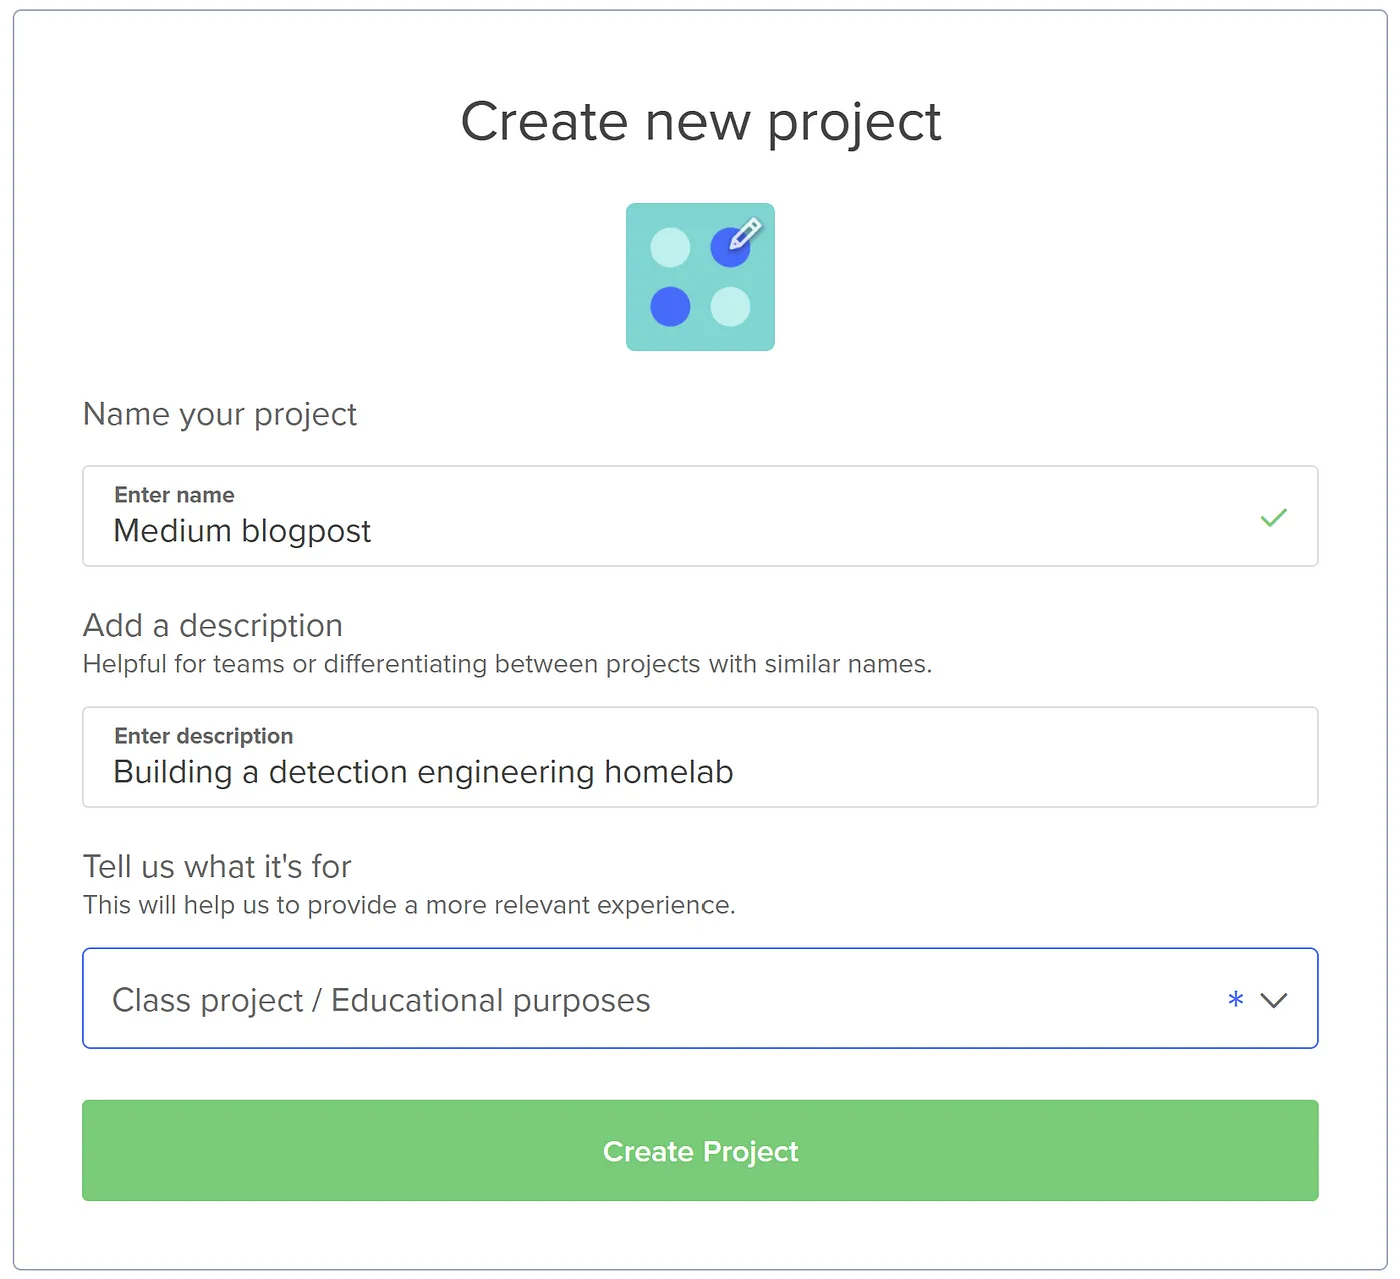
- To your upper left click: “+New project” and choose how you want to name your project (e.g. “Lab environment”) and choose how you want to fill in the other two options.

Step 3: Create and configure SSH key
Although password authentication is possible to set up, SSH keys provide a more secure way of logging into your server.
To use key-based authentication, you first need to generate a public & private key pair on your device (e.g. Laptop). ssh-keygen.exe is used to generate key files for the algorithms DSA, RSA, ECDSA, or Ed25519. To choose a specific algorithm you can specify one combined with the -t flag. If no algorithm is specified, RSA is used by the time of writing.
Generating a SSH key pair is of course just as possible on linux and macos, i’m however demonstrating the windows way by using powershell.
3.1 Creating SSH key
If you already created a SSH key pair on your device move to 3.2.
1. To generate the key pair, open a powershell prompt on your device, type and press Enter:
ssh-keygen
Or specify an algorithm of your choosing:
ssh-keygen -t Ed25519
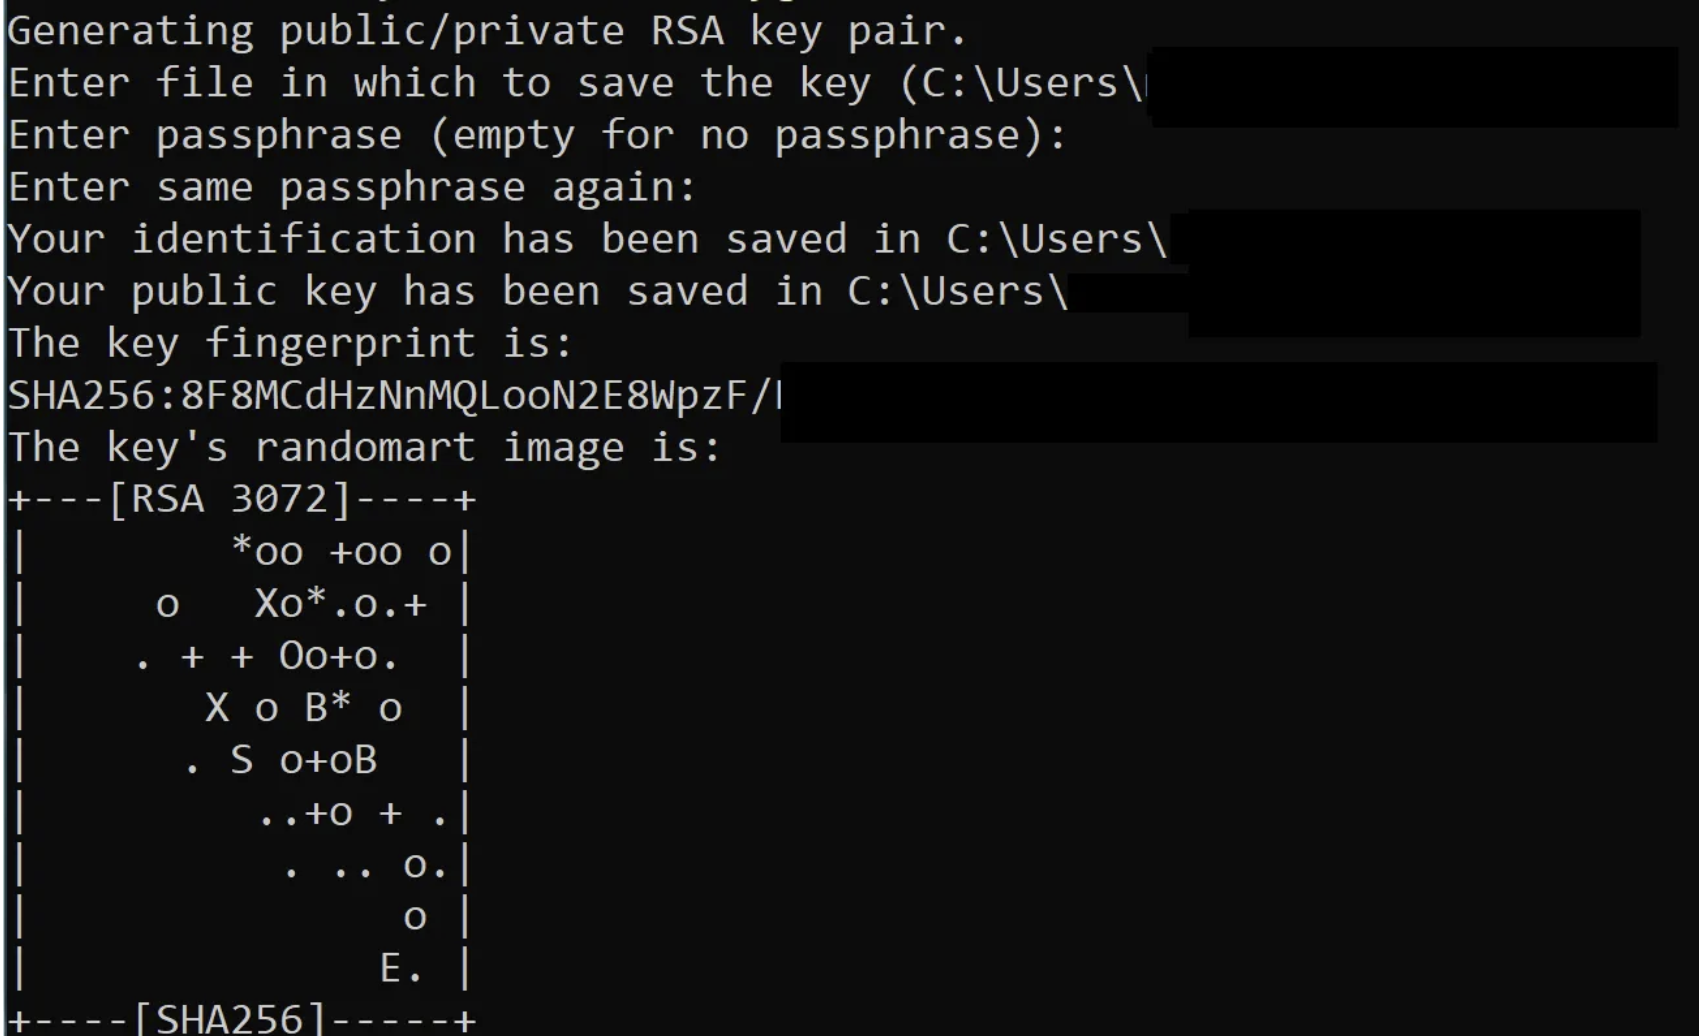
2. This will generate your key pair, you’ll be prompted to fill in a path to write the keys to, or choose the default. Press enter.
3. You’ll now be prompted to use a passphrase to encrypt your private key files. The passphrase can be empty but it’s not recommended. The passphrase works with the key file basically to provide two-factor authentication.
4. Now you have a public/private key pair in the location specified. The .pub files are public keys and files without an extension are private keys. Remember that private key files are the equivalent of a password and should be protected the same way you protect your password.
Below output should represent something similar you’re seeing:

3.2 Setup SSH public key as authentication method
Now you have a SSH key pair generated on your personal device, let’s move on to configuring the SSH key in your Digital Ocean account.
1. Browse to: https://cloud.digitalocean.com/account/security
2. Click “Add SSH Key”:
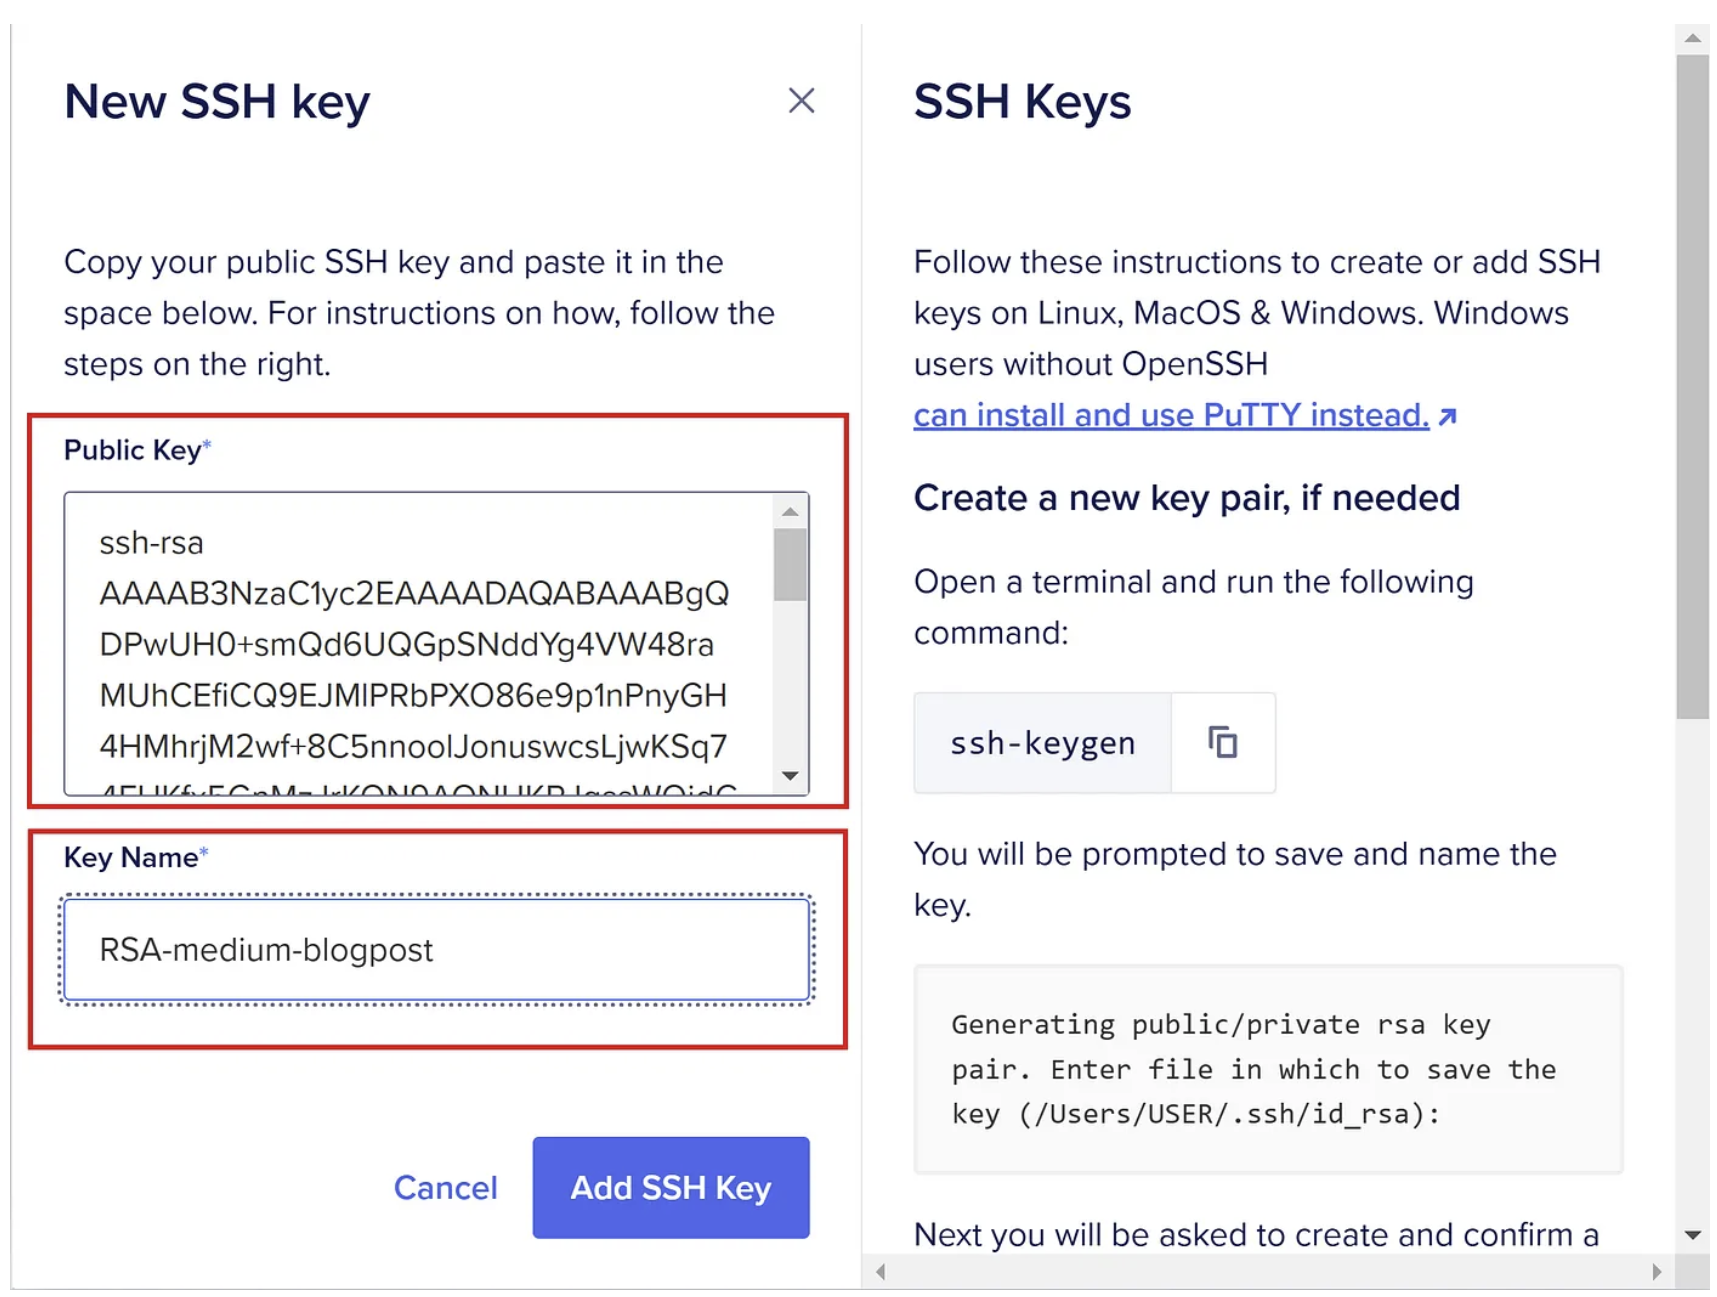
3. Now open your .pub file with a simple text editor like notepad and copy the content and paste it in the public key field.
4. Name your key file and press “Add SSH Key”:

This should result in a successful creation of your SSH key and which you can use in step 4, good stuff.
Step 4: Create a Docker droplet
- Browse to: https://marketplace.digitalocean.com/apps/docker
- Click “Create Docker Droplet”, you will then be redirected to the onboarding page;

Configuring the Docker droplet requirements
- Choose your region (choose your current region);
- Choose your datacenter: select the region closest to you;
- Choose an image: should likely be Docker on ubuntu (version 22.xx);
- Choose size: for now keep this on Basic;
- CPU options: Regular, SSD;
> My advice: 8GB RAM, 60 GB SSD Disk and 5TB transfer.
> Which costs $ 0.063/hour by the time of writing.
Inbound bandwidth to Droplets is always free. To calculate bandwidth costs for your Droplets, use the Bandwidth Calculator. - Skip additional storage and backup options for now;
- Choose authentication method: SSH Key. Choose your recently configured SSH key;
- Since this option is free and I like metrics I always choose:
“Add improved metrics monitoring and alerting (free)”; - Quantity: keep at 1 droplet;
- Hostname: choose a name you prefer and select the project you’ve created earlier;
- Click: “Create droplet” !
Step 5: Configure virtual memory
Elastic requires an increase in standard memory settings (the VM max map count), the default operating system limits on mmap count is too low, which may result in out of memory errors.
5.1 First time login to Docker droplet
1. Go to your account> your project> click your droplet;
2. Click Access> “Launch Droplet Console”
This opens a console session and you’re in, ready to continue setting things up within the Docker droplet.
5.2 Set virtual memory value
To set this value permanently, update the vm.max_map_count setting in /etc/sysctl.conf. Check out Elastic's documentation.
1. Increase limit permanently by running the following command:
nano /etc/sysctl.conf
2. Likely everything in the file is commented out, scroll down and add the following line:
vm.max_map_count=262144
3. Save and exit the file: Ctrl + x > press y for yes > Enter.
Great!
So this wraps up part 1, I hope you found it informative. I chose to make this a two part series so the steps are outlined in a clear and comprehensive manner and everyone should succeed in setting things up.
Next part we will:
- Deploy the Elastic stack on docker;
- Utilize docker-compose with the necessary YAML files;
- Adding a virtual machine and install the Elastic agent for log forwarding;
- Create a first detection rule.
If anything, feel free to reach out, I'd be happy to help and am open to any feedback. Cheers and hopefully until the next.

Comments