19/11/2024 0 Comments
How to create a Detection Engineering Lab — Part 2
A Two-Part series on building a Detection Engineering testing environment.
Welcome back to part 2 of the series. In this part, we’ll cover:
- Deploying the Elastic stack on Docker;
- Using Docker Compose to simplify the container deployment process with the necessary configuration files;
- Setting up a virtual machine and installing the Elastic Agent for log forwarding;
Creating our first detection rule to put everything into action.
I hope you’ve had a chance to set up the environment as outlined in Part 1. If not, that’s ok, it’s also possible to setup the Lab if you choose to run Docker Desktop or another way. Or just read on out of curiosity.
Technical requirements:
In this part, a (Windows) virtual machine will serve as the host for generating example logs that will be forwarded to the Elastic environment. The VM will be the only thing that runs from your device, the rest will be hosted and run in the cloud.
- Virtualbox or VMWare workstation software;
- 4 GB RAM assigned to VM (minimum recommendation);
- 60 GB disk space assigned to VM;
OK, let’s dive right in.
Step 1: Download Github repository
Github provides a way to download the entire repository as a compressed .tar.gz file. You can use wget to download the repo and then extract it in your Docker environment.
- Login to your Docker droplet or Docker desktop environment;
- In your terminal change to a desired directory (e.g. cd /home/user/);
- Download the repo and extract the files:
wget "https://github.com/madret/elastic/archive/refs/heads/main.tar.gz"tar -xzvf main.tar.gz
This will result in the creation of a directory named elastic-main and the following folder and file structure within:
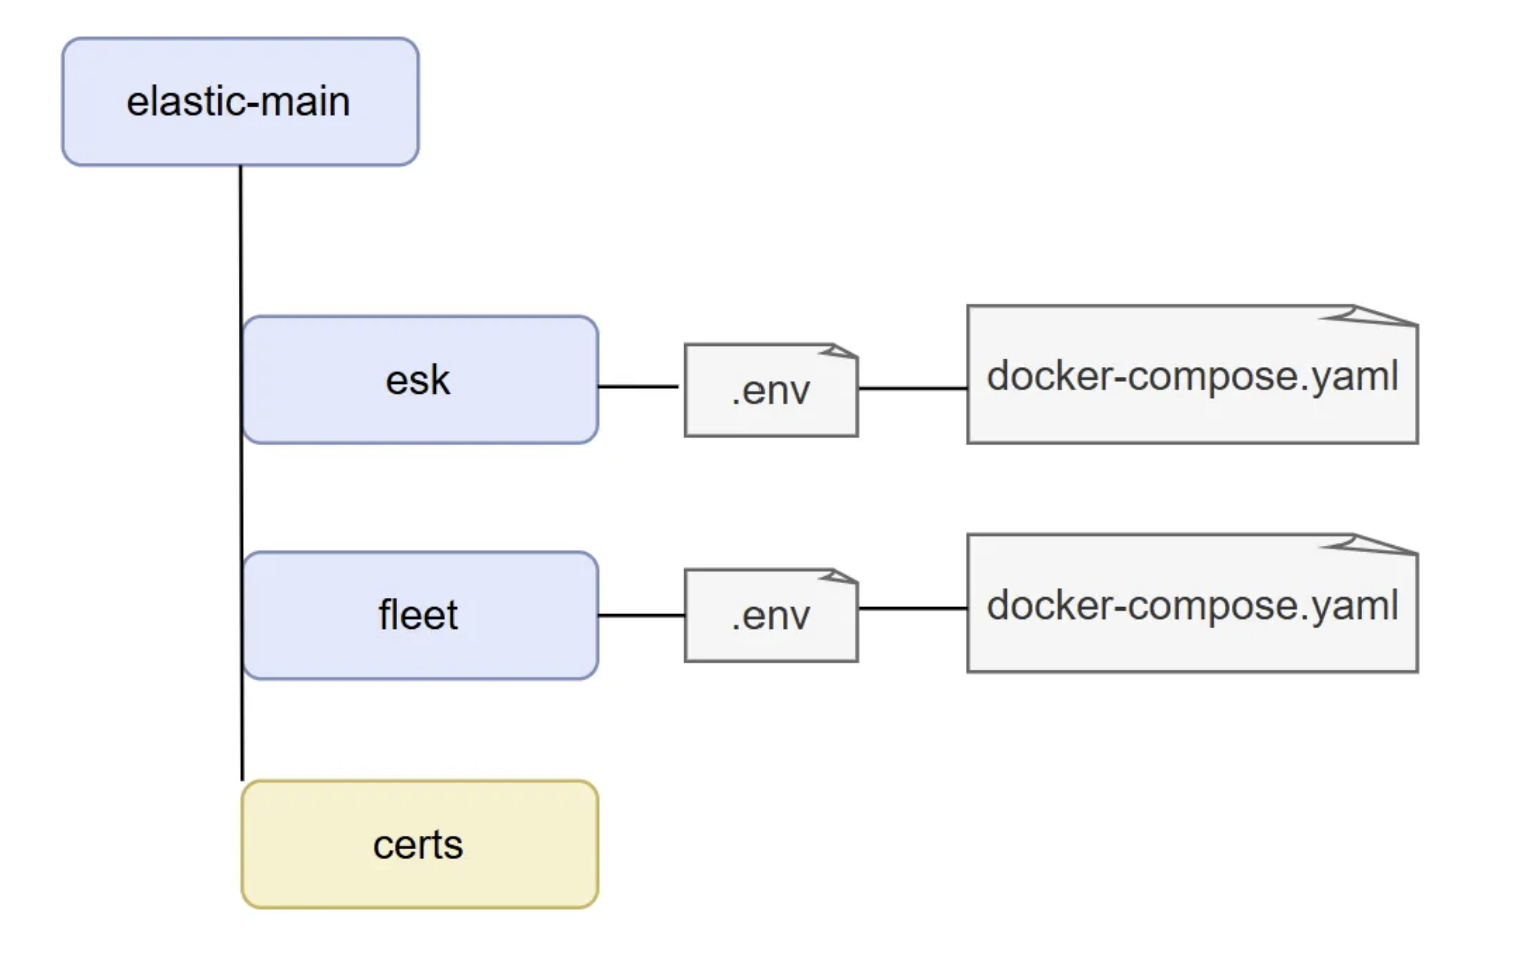
The esk directory holds the configuration for the elasticsearch and kibana containers, the fleet directory for the fleet server to manage Elastic Agents. Certificates will be out of scope for this setup.
Step 2: Configure credentials
Both docker compose files use environment variables files (.env), this helps with maintenance but also safeguards credentials when sharing the docker compose config files without exposing passwords.
Default environment variables content within the esk directory:
ELASTIC_PASSWORD="set password"
KIBANA_PASSWORD="set password"
STACK_VERSION=8.16.0
CLUSTER_NAME=docker-cluster
LICENSE=basic
ES_PORT=9200
KIBANA_PORT=5601
MEM_LIMIT=2147483648
XPACK_ENCRYPTEDSAVEDOBJECTS_ENCRYPTIONKEY="random 32 character string"
XPACK_SECURITY_ENCRYPTIONKEY="random 32 character string"
XPACK_REPORTING_ENCRYPTIONKEY="random 32 character string"
- Update the .env file and set the credentials for the credential values in "quotes". Open your password manager and save the credentials. The elastic password is the one that you’ll be using to sign into the web interface later on.
- Now that you’ve updated the 5 values in the .env file with the credentials of your choosing you’re ready to spin up the containers via docker compose.
Step 3: Spin up the Elastic containers
In the following examples, commands that typically require sudo will be shown without it. Ideally you’ve setup a user account with the necessary privileges, while running as the root user gives you complete control over a system it is also dangerous and possibly destructive. -how to add users on ubuntu.
1. Move to the esk directory where the .env and docker compose files are located and run:
docker compose up -d
this will start up the elastic and kibana containers. When the containers have a status of running you can move on to enter the web interface.
The -d flag stands for detached mode. When this flag is used, Docker Compose runs the containers in the background and returns control of the terminal to you immediately, instead of displaying the logs and keeping the terminal attached to the container’s processes. However running the command without the -d flag results in verbosity and can be used for debugging.
2. Browse to http://IP_Address:5601, you should be greeted with a login portal;
3. Login with username elastic and the password as defined in your .env file:
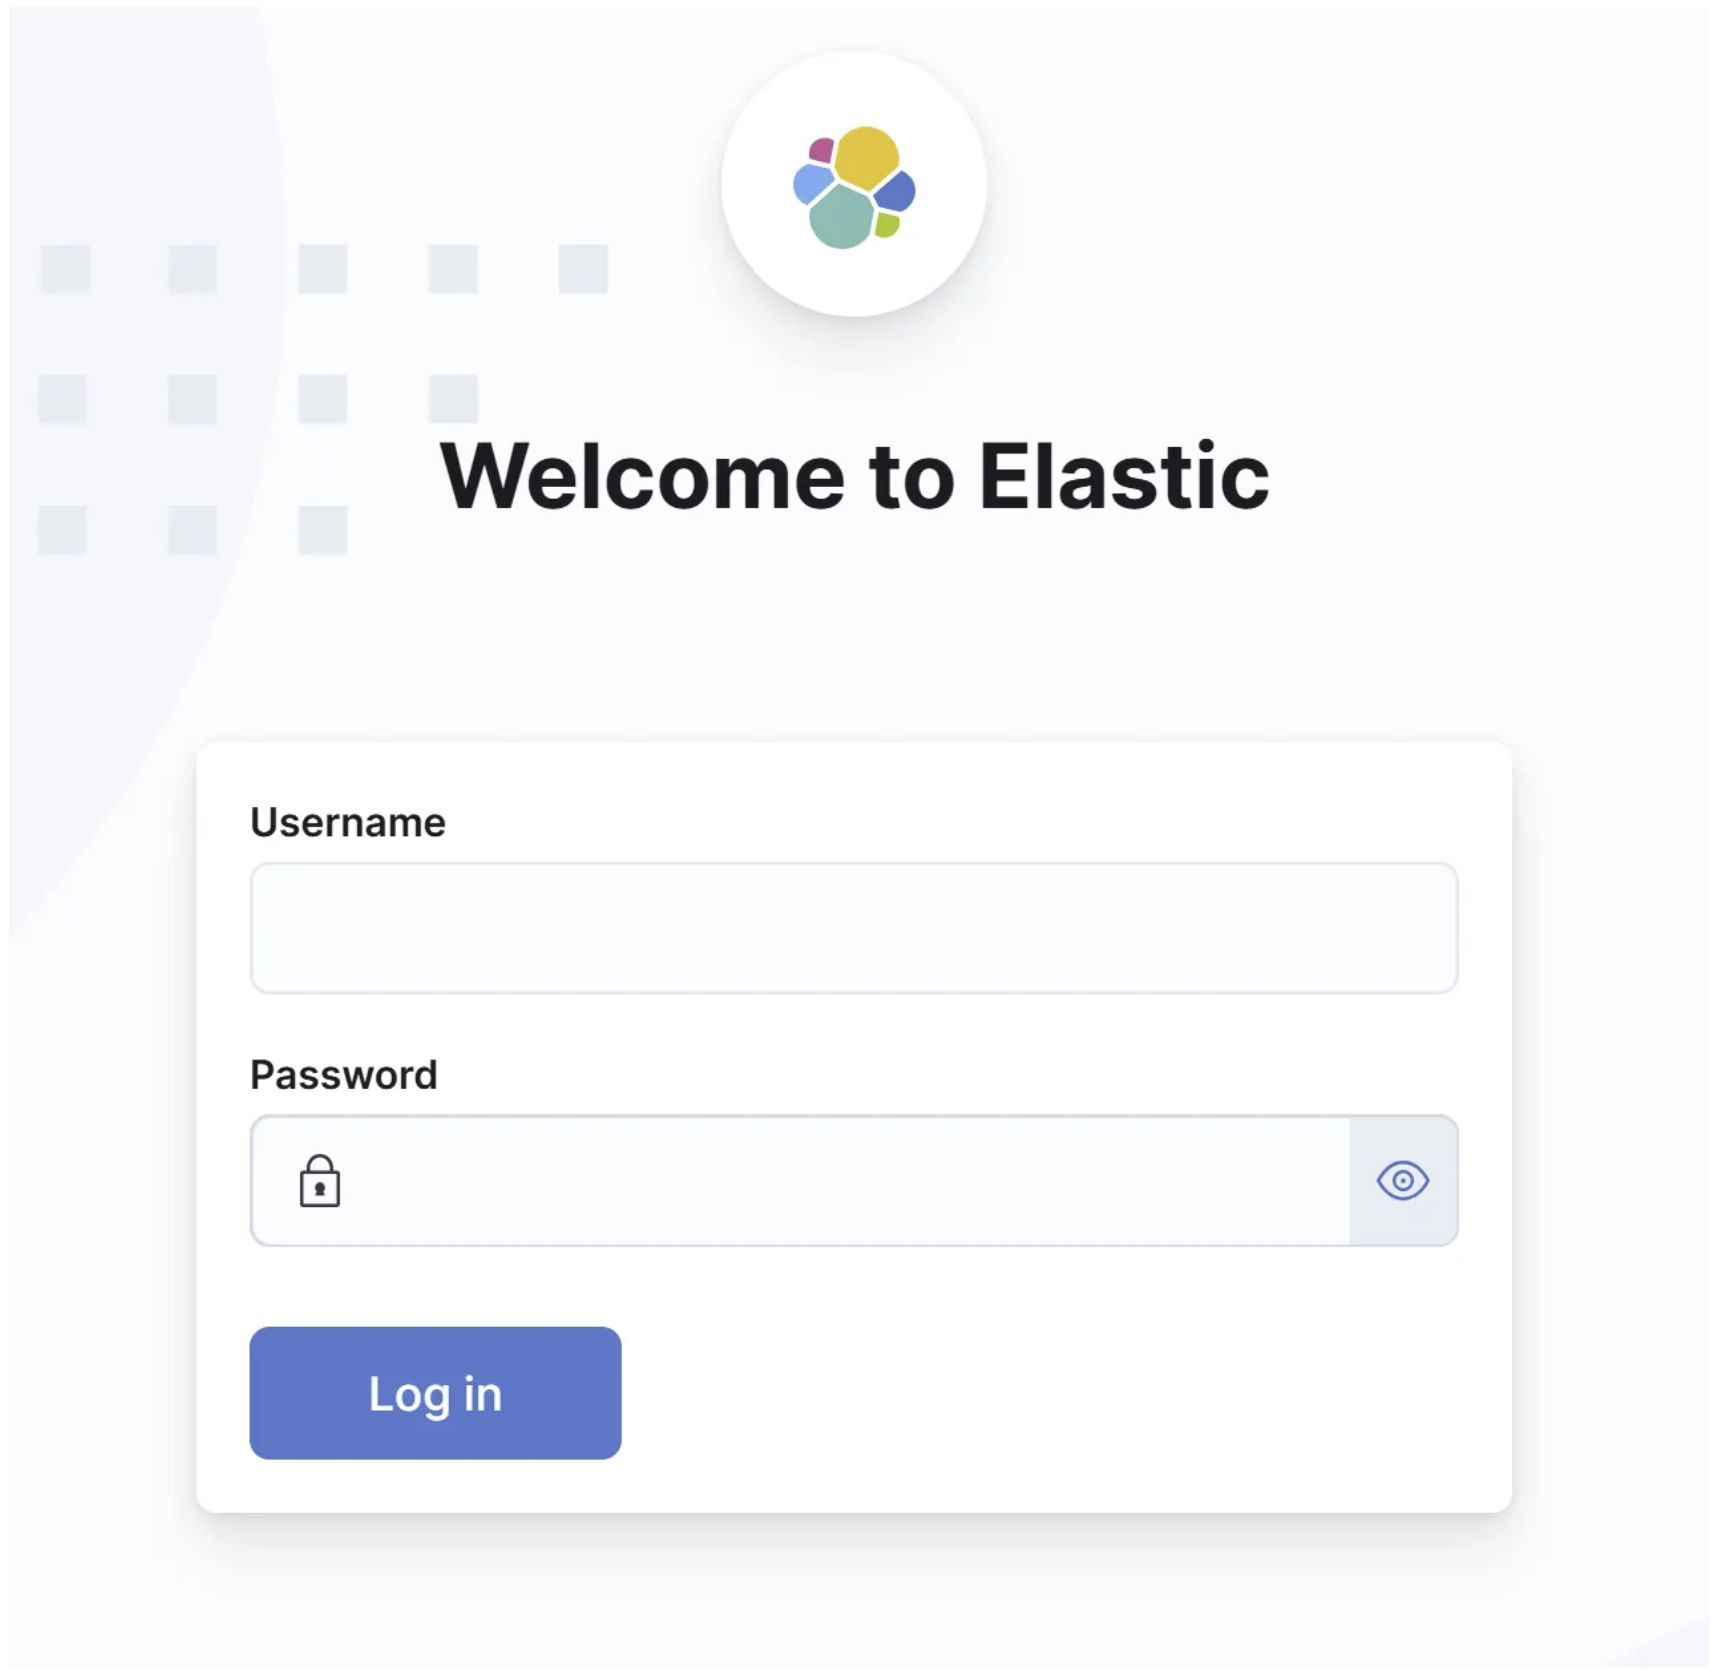
I won’t go into detail but if you’re exposing the web interface to the internet think about IP whitelisting your public IP address (or ISP range) as a security measure with a Firewall rule.
You’ve now successfully set up the main part of the elastic stack.
Step 4: Configure Fleet server
1. While still logged in to the kibana web portal browse to: http://IP_Address:5601/app/fleet/agents
2. This will show the configuration window of “Add a Fleet Server”.
3. The fleet server host value should be your your-docker-host-IP with port 8220 (e.g. https://IP_Address:8220).
4. Press “Generate Fleet server policy”, this will show an installation script. We’ll need the Linux Tar option, but only copy the --fleet-server-service-token value:
5. Go back to your Docker host and paste the service token value into the .env file located in the fleet directory:
FLEET_SERVER_SERVICE_TOKEN="your service token generated from kibana"6. Now that the .env file is updated with the correct token, we can connect the fleet server. Make sure that you’re in the fleet directory where the correct docker-compose.yaml file is located and run:
docker compose up -d
If you’d like to list all your containers whether they are running, stopped, or in another state, run the command:
docker ps -a
Go back to the web portal and wait for it…
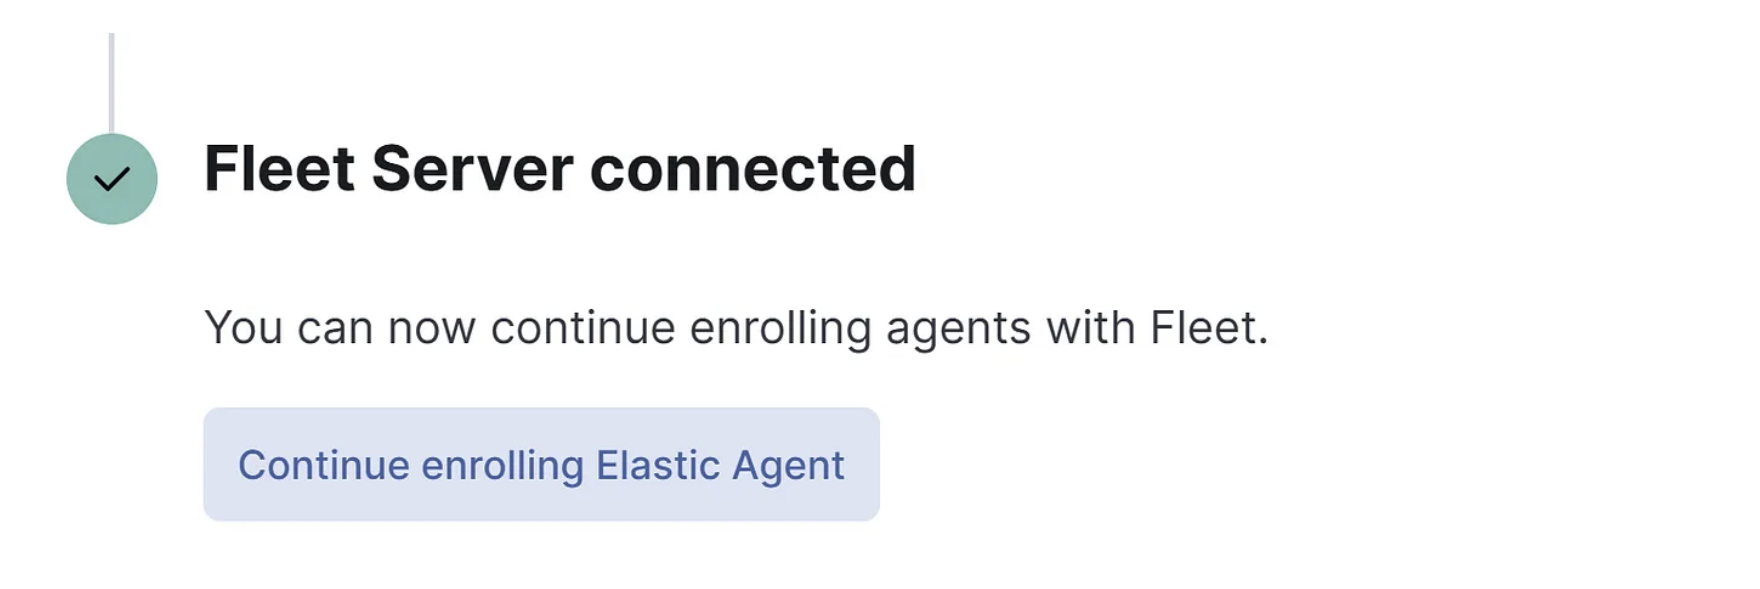
7. Lastly we should modify the output settings of the Fleet configuration, the Elasticsearch URLs where Elastic Agents will send data to by default are exposed on port 9200 for self-managed clusters. However instead of the default localhost make sure to configure the correct IP address of your Docker instance. See below example and verify your IP + port settings:
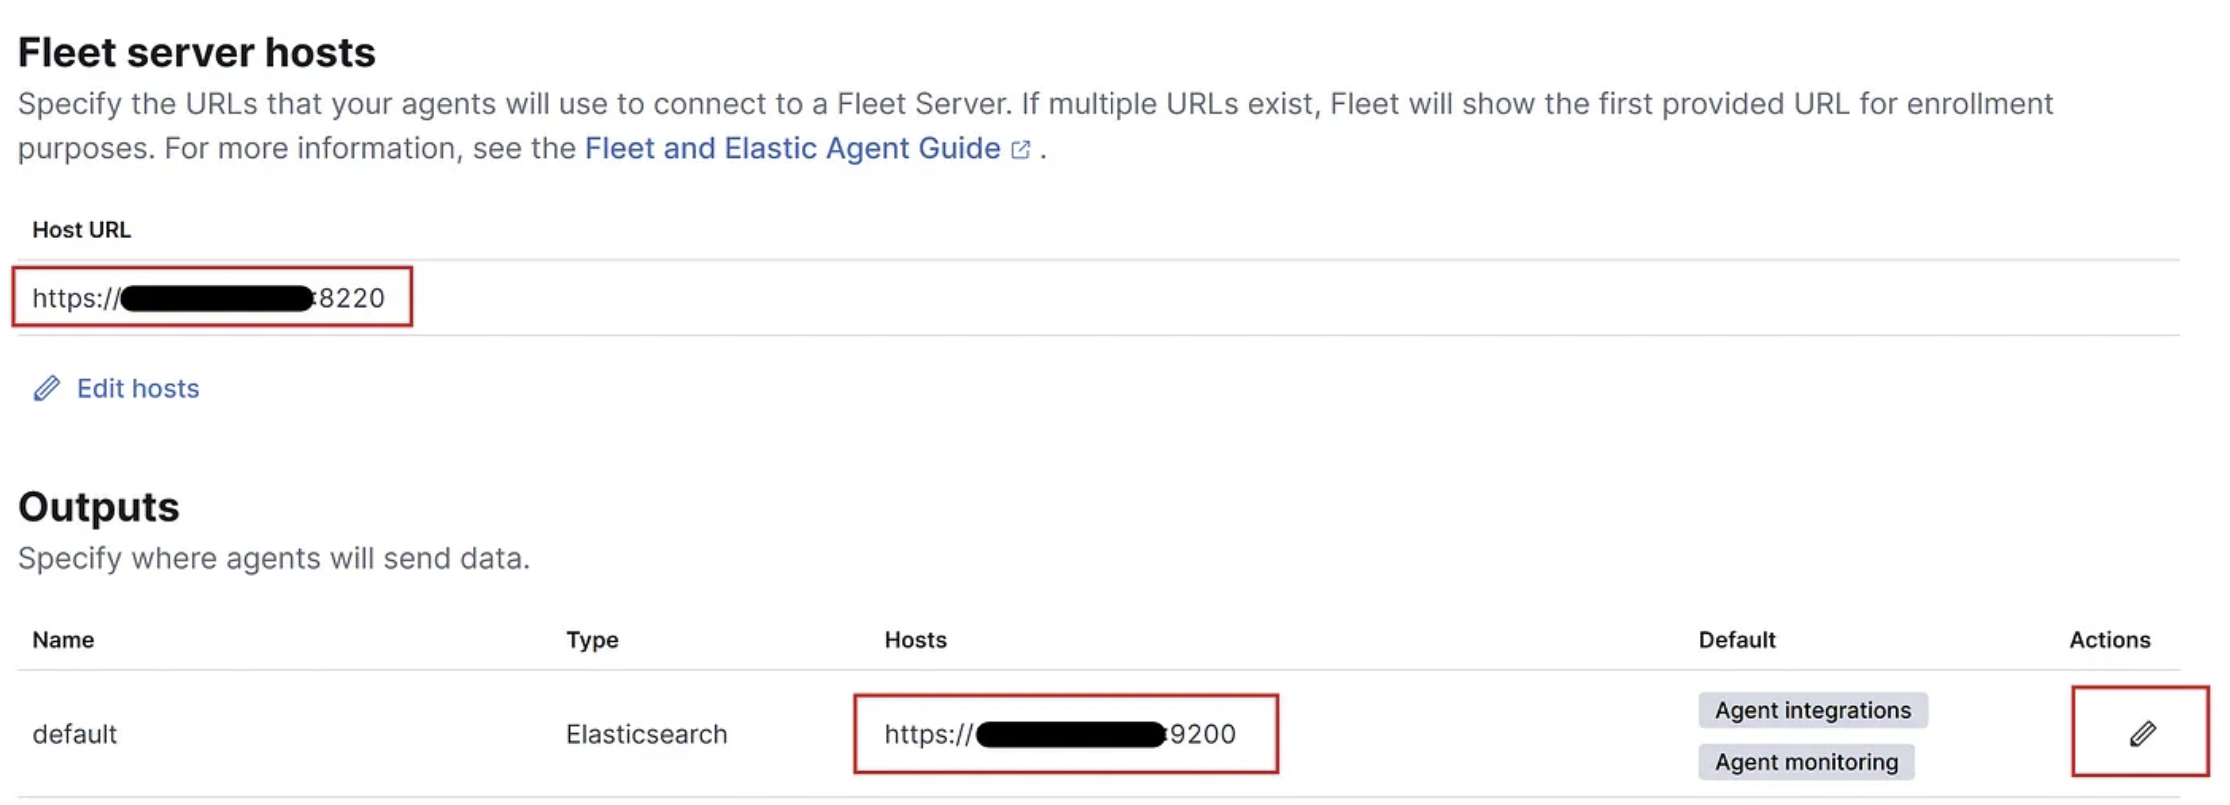
8. Now click the edit pencil of the outputs config and modify the advanced YAML configuration, by adding:
> ssl.verification_mode: none & click “Save and apply settings”.
Step 5: Install Elastic agent on virtual machine
Before proceeding with this section, you’ll need to have VirtualBox or VMWare installed on your system and a Windows Virtual Machine (VM) configured.
1. While still logged in to the kibana web portal browse to: http://your_docker_host-IP:5601/app/fleet/agents
2. Select ”Add Agent”. An agent enrolment section opens. Create a new policy (e.g. “WINOS”) and select Enroll in Fleet (recommended) — Enroll in Elastic Agent in Fleet to automatically deploy updates and centrally manage the agent.
3. For step 3 select the appropriate platform, in our case Windows. This will generate powershell commands that need to be executed on the Virtual Machine in an elevated prompt. One addition however is appending the insecure flag, the --insecure flag tells the Elastic Agent to bypass the certificate validation step. Which is not recommended in production environments but setting up certificates is out of scope for this blog. To read more about setting up certificates check out the Elastic docs.
4. On the virtual machine open a powershell window as Administrator, paste the commands + --insecure and hit Enter. The Elastic agent download process starts.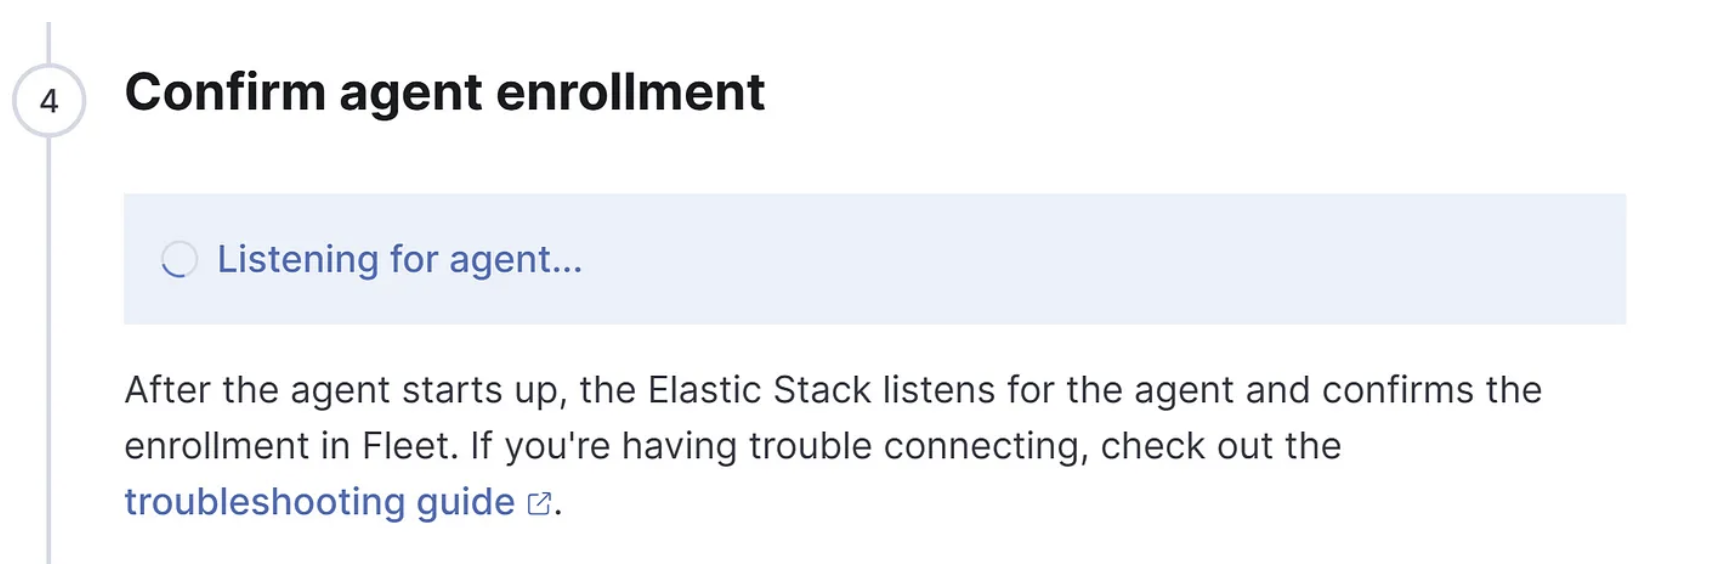
5. After the agent is successfully installed and incoming data is confirmed, you can inspect the agent policy settings by browsing to: http://your_docker_host-IP:5601/app/fleet/policies and selecting the policy.
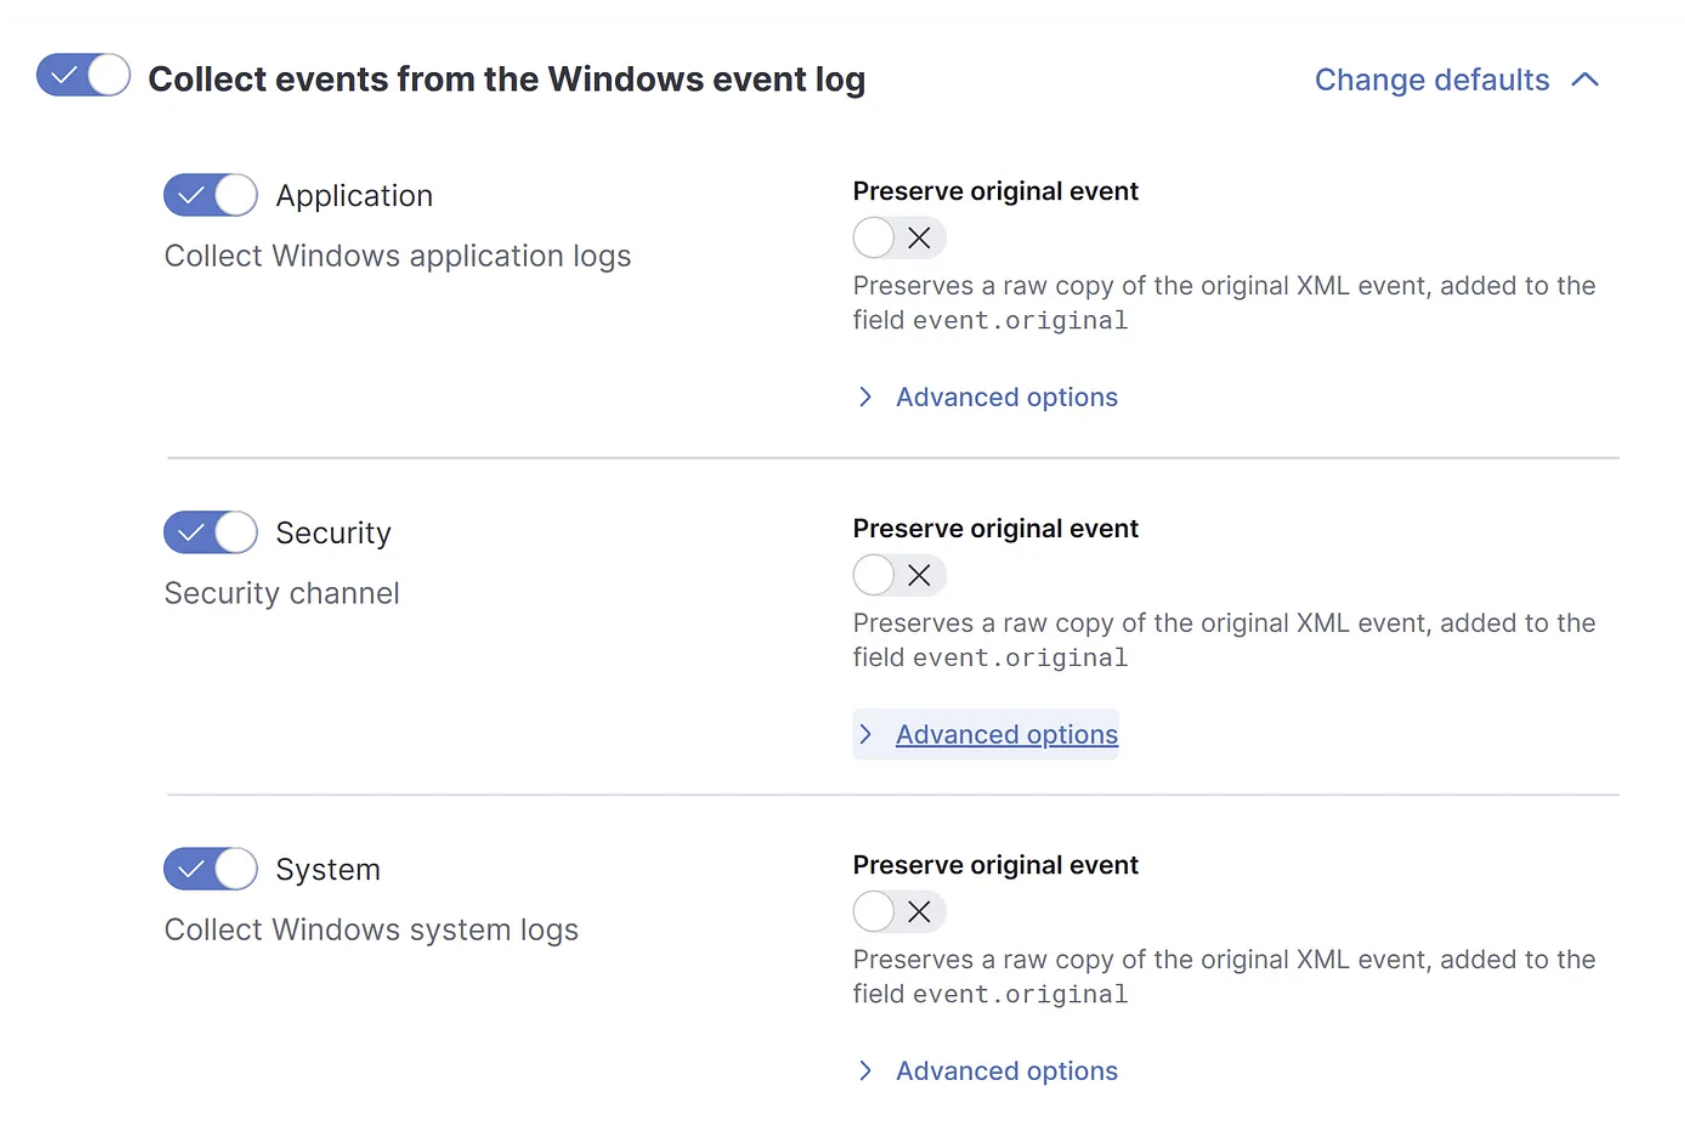
We will focus on Windows event logs, it’s possible to modify the default settings by going into Advanced options to select more custom desired Event IDs. Knowing the most useful event IDs for the right use case is extremely valuable for developing detections. For additional information on collecting and parsing event logs from any Windows event log channel with the Elastic Agent, check out the following Elastic documentation.
6. Verify the incoming events by going to the Discover section in Kibana, browse to http://your_docker_host-IP:5601/app/discover or just select Discover from the search bar. On your left you should see numerous available fields populated.
Time to discover the various event logs.
Step 6: Build first detection query
OK, let’s come up with a simplified detection case. Detection assignments can come via different ways, an example can be due to a CISA advisory got released and higher management or a customer may ask “do we detect this” ? For this case we’re referencing this CISA advisory:

6.1 Generate example logs
For this example I've configured a custom integration for a Microsoft-Windows-PowerShell/Operational channel. This captures, for example, event ID 4104 — Powershell Script block logging. Script block logging records blocks of code as they are executed by the PowerShell engine, thereby capturing the full contents of code executed by an attacker, including scripts and commands. To read more about Powershell logging, check out this awesome article by Mandiant.
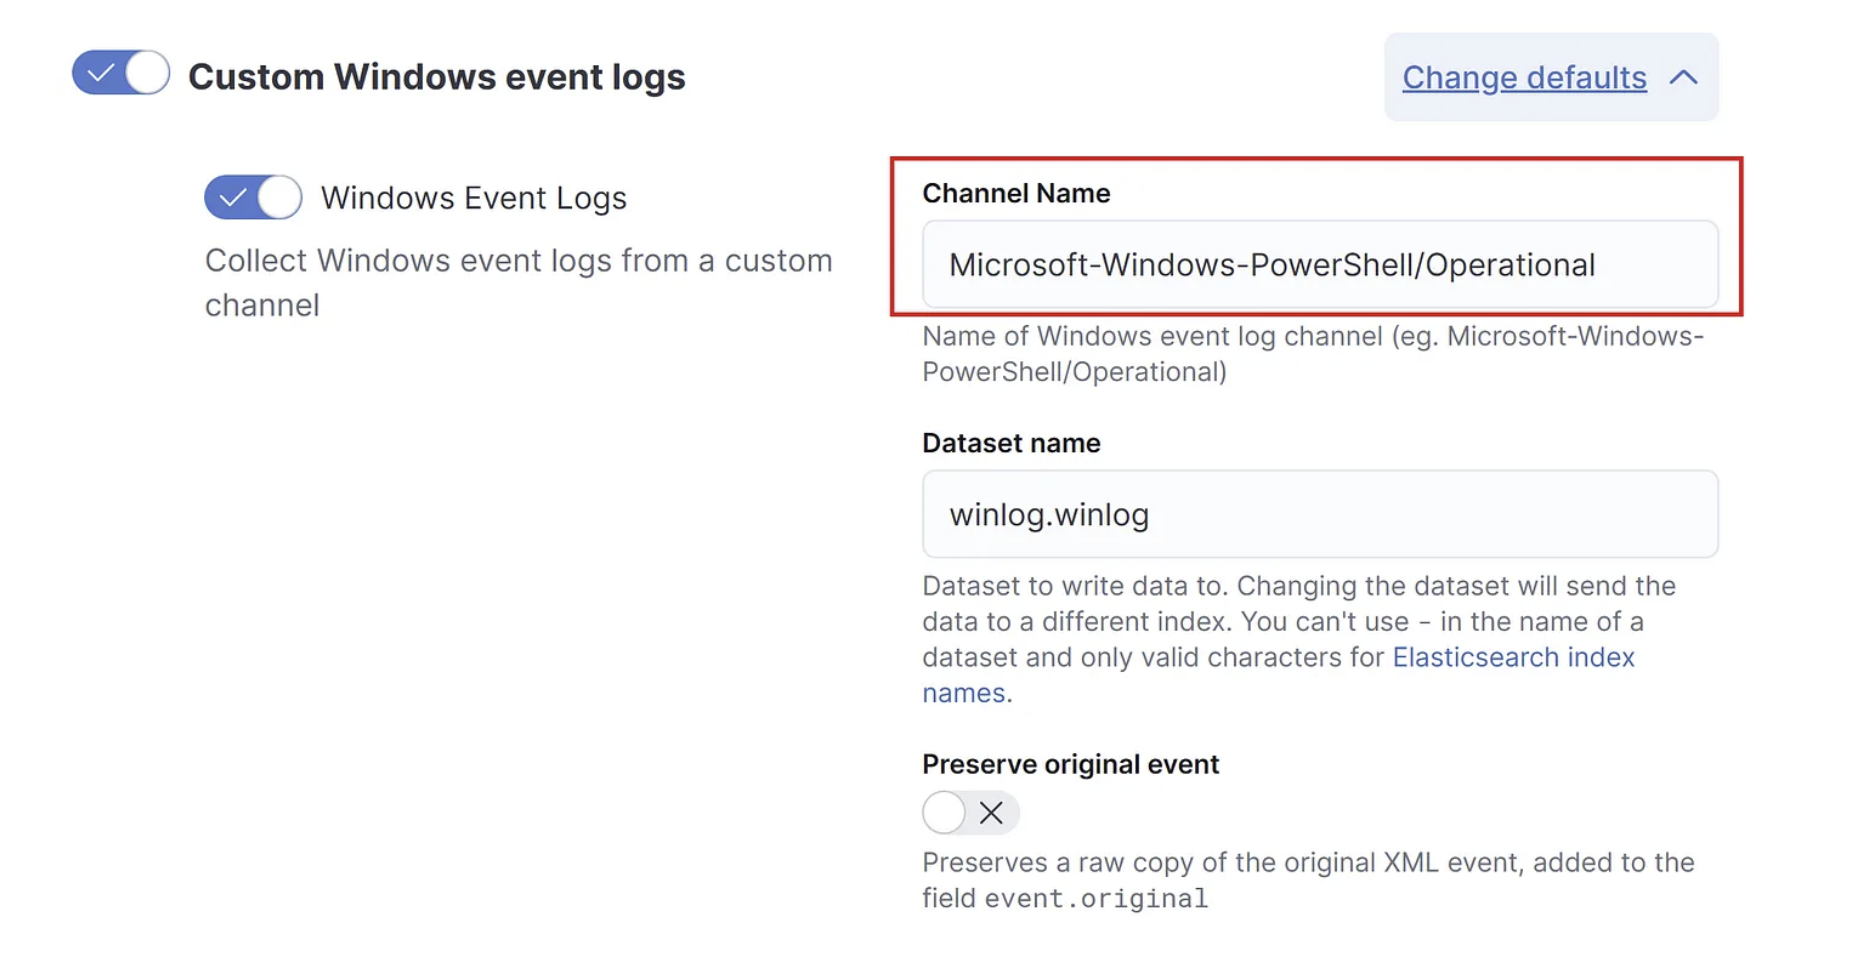
So i’ve simulated a reconnaissance “attack” via Powershell by running a script from the PS command-line, generating an Event ID 4104 log entry.
6.2 Detection:
Looking back at the assignment at hand, detect 4 variants of the whoami command executed from the command-line. Without going into processes or procedures. Let’s keep it simple and straightforward:
1. We’ll take Event ID 4688 for process creation events with command-line logging enabled together with the Powershell Event ID 4104 as mentioned earlier.
2. Now add wildcards to the whoami variants and our query should be:
(event.code: 4688 OR event.code: 4104)
AND (message: "*whoami /priv*" OR message: "*whoami /all*" OR
message: "*whoami /groups*" OR message: "*whoami /domain*")
Let’s hit Enter and….

We can see a hit on the whoami /priv variant from my super malicious powershell script. Again, this is a simplified way to get familiar with creating some Detection logic and a small touch of the Kibana Query Language, one of many query languages out there.
And there you have it. You’re all set to research, explore, test and develop various techniques in an environment you setup yourself. I hope you found this series interesting and took away something valuable from it.

Comments